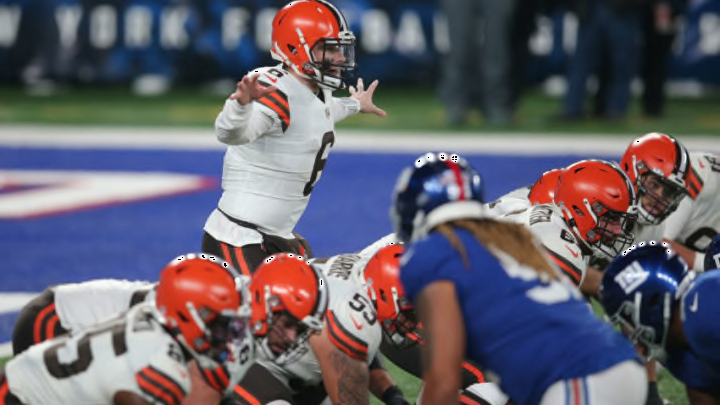
Colin Cowherd wants you to think the Browns are better when Baker Mayfield throws less.
There would be some truth to the notion that the Browns, as a team, are better when Baker Mayfield doesn’t have to throw more than the usual. Where the lie comes from is the notion that the Browns are better because Mayfield is throwing less. No, that’s actually not true.
The Browns being better when Mayfield throws less is a flat-out lie in that context. We love stats here at Factor of Sadness, so we decided to stat count and looked at Mayfield’s career numbers when he throws a lot. Why did we do such a tedious task? Good question, it’s because people like Mike Tannenbaum and Collin Cowherd continue to not do their research and lie when criticizing the Browns and Mayfield. We’re not down with that.
So here’s what we did. We looked at each and every season Mayfield has played and the number of attempts he made per season. We found that per game, Mayfield attempted 34 passes as a rookie, 32 passes in his second year, and 30 passes in his most recent season.
We used that as a starting point. Any game that he threw more than his average was counted towards his “throws more = bad” argument. No one ever said how much more, so we’re setting the standard. One more than average is all you need to get counted.
Starting with that baseline, we looked at his play in each of those games for that given season. How many passes attempted, completed, touchdowns, interceptions, and quarterback win/loss record were all considered.
Yards and yards per game were excluded, simply because the man nearly throws nearly 4,000 yards per season. That’s not an issue.
So what did we find? Well, in his rookie year his average attempts per game were 34, so the games where he “threw too much” came out to 221 completions against 365 attempts, which gives you a success rate of 60.5%. He also threw 15 touchdowns, 13 interceptions and had a win/loss record of 2-6 in those games.
His second season saw him average 33 attempts per game, giving us a stat line of 191 completions, against 303 attempts for a rate of 63%, with 12 touchdowns and 10 interceptions and a record of 2-5.
In his most recent year, 2020, Mayfield attempted 30 passes per game, with a stat line of 150 completions against 240 attempts for a rate of 62.5%. He finished the year with 11 touchdowns, and just four interceptions while improving his record of 3-3.
That means, for his career in games where he threw more than his seasonal average, Mayfield has completed 563 passes on 908 attempts for a percentage of 61.89%, with 38 touchdowns to 27 interceptions and a record of 7-14.
That means that his record has less to do about his play than people will make you think. What the stats tell us actually is that the play of the team is the catalyst for why Mayfield has to throw more. He’s shown that when called upon he can produce, but since Mayfield hasn’t had a defense in three years, it’s not surprising that his record is so terrible. By the way, a quarterback’s record isn’t exactly a reliable stat. It’s why baseball no longer puts the same onus on a pitcher’s win/loss record.
There are just too many mitigating factors that go into why a pitcher or a quarterback, wins or loses.
So what do Mayfield‘s numbers look like next to each other? Well, when he’s throwing less, he’s completing passes at near the same rate (61.87%) and has nearly as many touchdowns with 37. He has fewer interceptions with 16 and has a better win/loss record at 16-9.
This again goes to prove the point of Mayfield having to do more to bail out his defenses. Want further proof? In the 21 games where Mayfield threw more than his seasonal average, the Browns defense allowed an averaged of 29.7 points.
The team didn’t play badly because Mayfield threw a lot, Mayfield has to throw a lot because the team played bad.
If anything, Mayfield is nearly the same quarterback whether he’s throwing 20 times or 30 times a game. Consider that myth debunked.
